strong2024-10
Show HN: Data Formulator — 212 points, 34 commentsStrong initial reception for a Microsoft Research tool.
212 pts / 34 commentsHN community
AI-powered data visualization tool from Microsoft Research. Interactive AI agents iterate on chart design from raw data. 15.1K stars, MIT license, very active development.
Where it wins
Microsoft Research backing with MIT license — best combo of institutional credibility and open access
Interactive AI agents for iterative data visualization — describe what you want, refine conversationally
Very active development (pushed day before ranking)
15.1K stars — strong community adoption for a research tool
Desktop application — runs locally, no cloud dependency
Bridges data prep and visualization in one tool
Where to be skeptical
Desktop-only — not a library you pip install
Smaller contributor base (27)
No deployment/sharing story — local analysis tool only
Editorial verdict
Best AI-powered data visualization tool — Microsoft Research quality, fully open source. Fills a niche no other tool covers: conversational, iterative chart building from raw data.
Source
Videos
Reviews, tutorials, and comparisons from the community.
Data Formulator Tutorial
Data Formulator Release Announcement
Related
Marimo
93Reactive Python notebook that replaces Jupyter. Pure .py files, reactive DAG execution, dual-mode (notebook → app). 19.8K stars, 1.9M monthly PyPI downloads, 261 contributors.
Streamlit
90The dominant Python data app framework. 44K stars, 31.8M monthly PyPI downloads, acquired by Snowflake for $800M. Ecosystem giant for deploying data apps — the standard answer for sharing Python analysis as a web app.
Observable Framework
84Static site generator for data apps with D3.js lineage. Full web dev power (HTML, CSS, JS, React). 3.4K stars, 16.7K npm monthly downloads, 360 pts on HN.
Evidence
78BI-as-code platform: SQL + Markdown → polished data reports. No JS/Python required. YC S21, 6K stars, 76 contributors. Git-versioned reports for SQL-first analysts.
Public evidence
Strong initial reception for a Microsoft Research tool.
Shows sustained development and continued community interest, though lower traction on repeat.
Raw GitHub source
Constrained peek so you can sanity-check the source material without leaving the site.
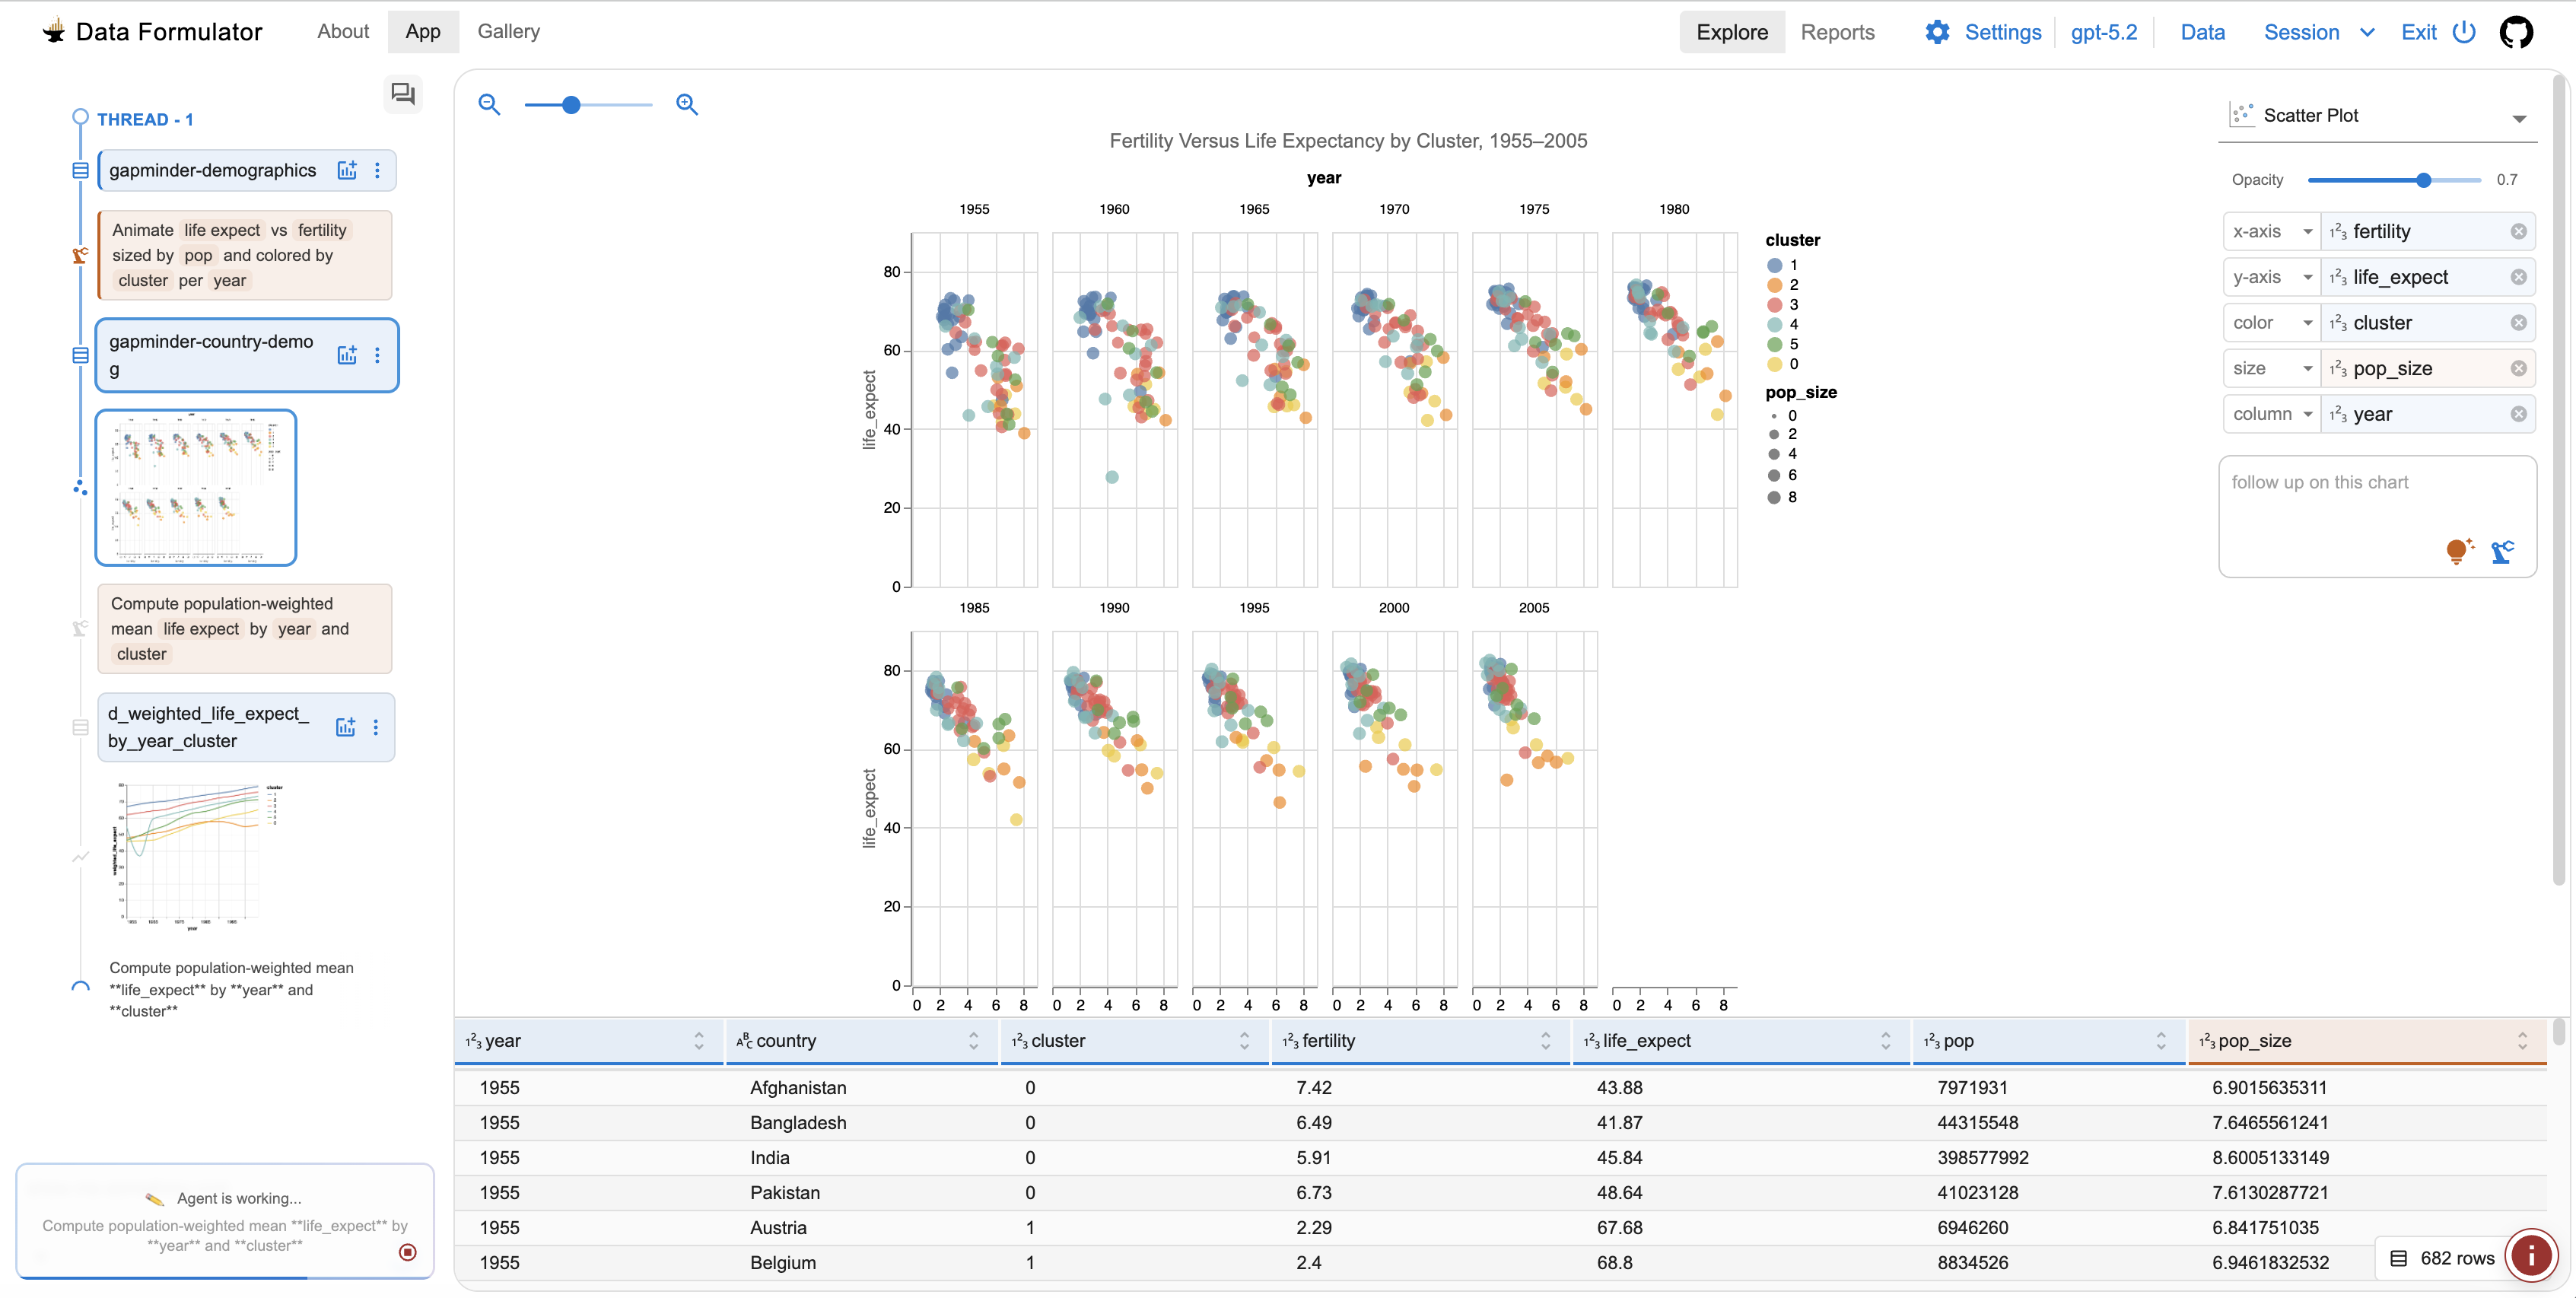
Your data lives everywhere — databases, warehouses, BI tools, files. Coding agents can help, but only after someone wires them up, and answers come back as walls of code or text that are hard to follow, refine, or share.
Data Formulator makes it simple: connect any data, ask anything, get charts you can edit, branch, and share — all on one interactive, visual canvas.
https://github.com/user-attachments/assets/8e4f8a08-6423-4227-a1f7-559e0126ce31
[05-28-2026] Data Formulator 0.7 — turn ANY data into insights in five easy steps:
➕ Persistent sessions & workspaces — identity-isolated, saved across restarts. Data Formulator is your de facto data analysis pane.
Multilingual UI — Data Formulator now speaks Chinese in addition to English (没错,DF现在会说中文了!). More languages on the way — contributions welcome.
Install with
pip install data_formulatoror run instantly withuvx data_formulator.
[!TIP] Are you a developer? Join us to shape the future of AI-powered data exploration! We're looking for help with new agents, data connectors, chart templates, and more. Check out the Developers' Guide and our open issues.
Here are milestones that lead to the current design:
DataAgent with thread memory, persistent workspaces, the semantic chart engine, and experimental knowledge distillation.uvx data_formulator or uv pip install data_formulatorData Formulator is a Microsoft Research project for data exploration with visualizations powered by AI agents. It combines UI interactions with natural language so analysts can communicate intent, branch into alternative analyses, and share results — starting from any data format (screenshot, text, CSV, or database).
Play with Data Formulator with one of the following options.
Option 1: Install via uv (recommended)
uv is an extremely fast Python package manager. If you have uv installed, you can run Data Formulator directly without any setup:
uvx data_formulator
Run uvx data_formulator --help to see all available options, such as custom port, sandboxing mode, and data storage location.
Option 2: Install via pip
Use pip for installation (recommend: install it in a virtual environment).
pip install data_formulator # install
python -m data_formulator # run
Data Formulator will be automatically opened in the browser at http://localhost:5567.
Option 3: Run with Docker
docker compose up --build
Open http://localhost:5567 in your browser. To stop, press Ctrl+C or run docker compose down.
Option 4: Codespaces
You can run Data Formulator in Codespaces; we have everything pre-configured. For more details, see CODESPACES.md.
![]()
Option 5: Working as developer
You can build Data Formulator locally and develop your own version. Check out details in DEVELOPMENT.md.
Besides uploading csv, tsv or xlsx files that contain structured data, you can ask Data Formulator to extract data from screenshots, text blocks or websites, or load data from databases use connectors. Then you are ready to explore. Ask visualizaiton questions, edit charts, or delegate some exploration tasks to agents. Then, create reports to share your insights.
https://github.com/user-attachments/assets/164aff58-9f93-4792-b8ed-9944578fbb72
@article{wang2024dataformulator2iteratively,
      title={Data Formulator 2: Iteratively Creating Rich Visualizations with AI},
      author={Chenglong Wang and Bongshin Lee and Steven Drucker and Dan Marshall and Jianfeng Gao},
      year={2024},
      booktitle={ArXiv preprint arXiv:2408.16119},
}