strong2024-03
Interesting ideas in Observable Framework — 360 pts on HNHigh engagement signals strong respect among technical audience.
360 pts / 63 commentsHN community
Static site generator for data apps with D3.js lineage. Full web dev power (HTML, CSS, JS, React). 3.4K stars, 16.7K npm monthly downloads, 360 pts on HN.
Where it wins
D3.js lineage — strongest visualization pedigree in the category
360 pts on HN — strong respect among technical users
Static site generator for data apps — build once, deploy anywhere, no server needed
Full web dev power (HTML, CSS, JS, React) — most flexible option for custom dashboards
Performance-sensitive dashboards at scale
Where to be skeptical
Requires JS/web dev skills — not accessible to SQL-only analysts
Smaller community than Streamlit
Steeper learning curve than Evidence for non-developers
Editorial verdict
Best for developer-built data dashboards with D3-quality visualization. If you need custom, interactive, D3-quality visualizations in a static site, Observable Framework is unmatched.
Source
Videos
Reviews, tutorials, and comparisons from the community.
Observable Overview Introduction
Observable Plot Overview
Related
Marimo
93Reactive Python notebook that replaces Jupyter. Pure .py files, reactive DAG execution, dual-mode (notebook → app). 19.8K stars, 1.9M monthly PyPI downloads, 261 contributors.
Streamlit
90The dominant Python data app framework. 44K stars, 31.8M monthly PyPI downloads, acquired by Snowflake for $800M. Ecosystem giant for deploying data apps — the standard answer for sharing Python analysis as a web app.
Data Formulator
82AI-powered data visualization tool from Microsoft Research. Interactive AI agents iterate on chart design from raw data. 15.1K stars, MIT license, very active development.
Evidence
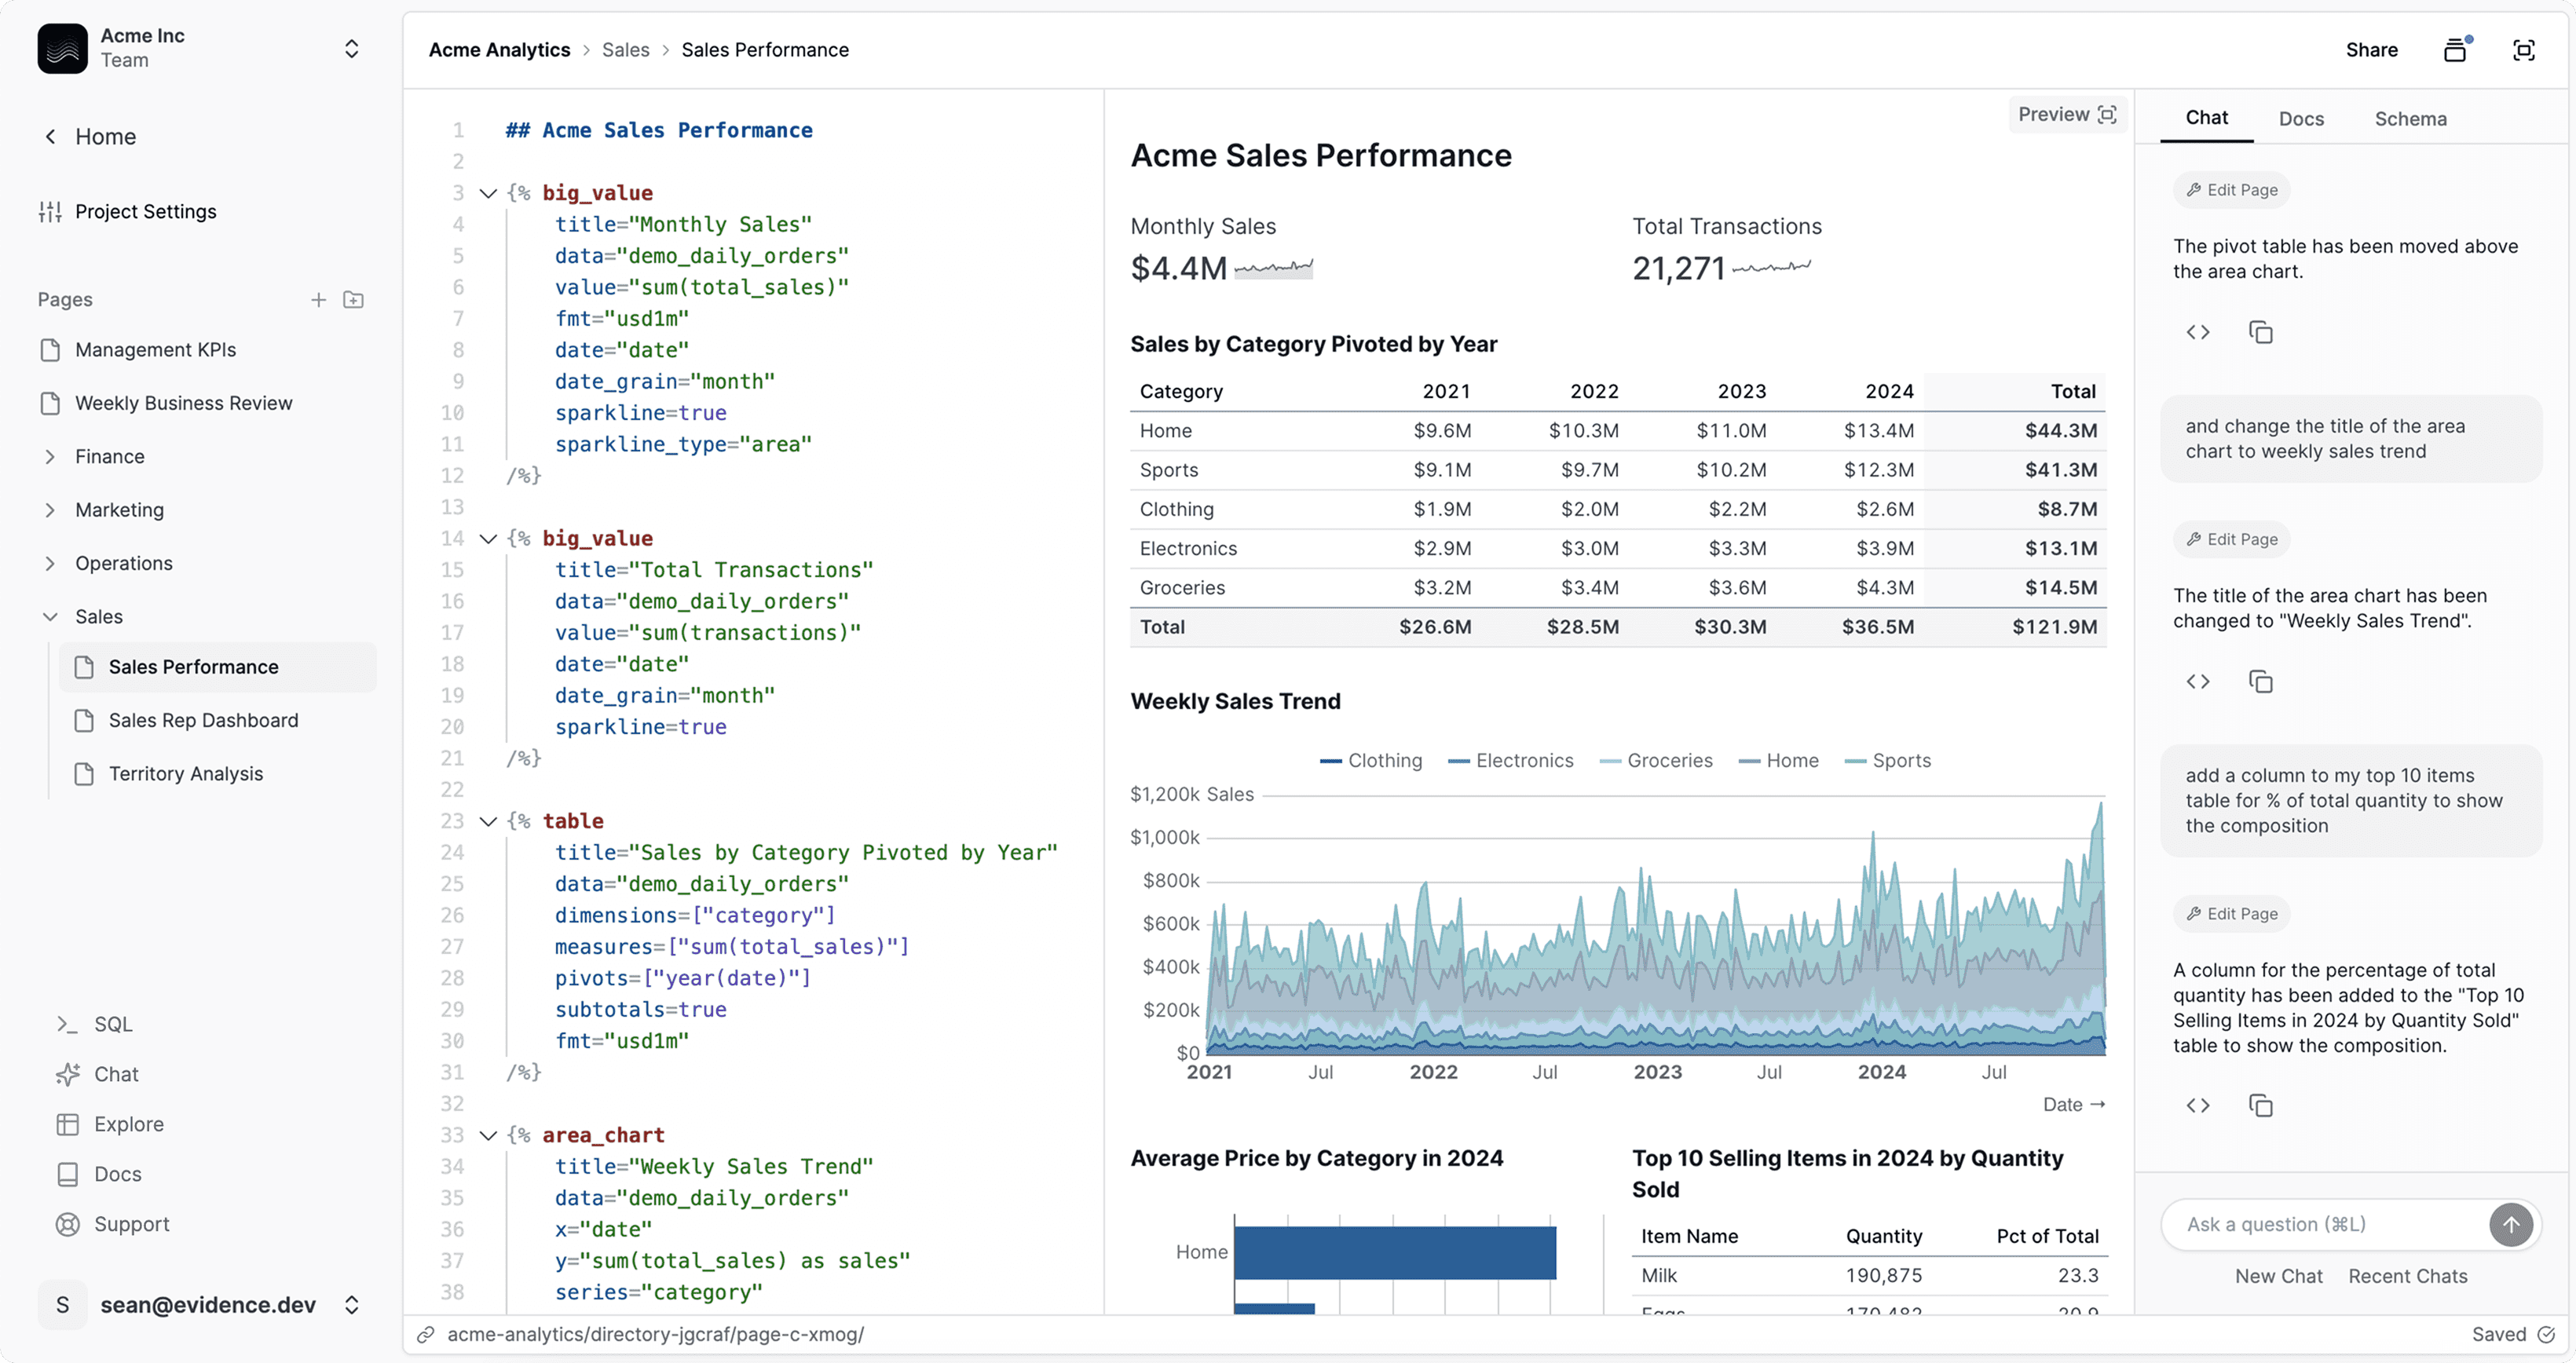
78BI-as-code platform: SQL + Markdown → polished data reports. No JS/Python required. YC S21, 6K stars, 76 contributors. Git-versioned reports for SQL-first analysts.
Public evidence
High engagement signals strong respect among technical audience.
Observable recommended for large-scale, performance-sensitive dashboards. Evidence better for SQL-only analysts.
Raw GitHub source
Constrained peek so you can sanity-check the source material without leaving the site.
Observable Framework is a free, open-source, static site generator for data apps, dashboards, reports, and more. Framework combines JavaScript on the front-end for interactive graphics with any language on the back-end for data analysis. Framework features data loaders that precompute static snapshots of data at build time for dashboards that load instantly.
<a href="https://observablehq.observablehq.cloud/oss-analytics/@observablehq/framework"> <picture> <source media="(prefers-color-scheme: dark)" srcset="https://observablehq.observablehq.cloud/oss-analytics/@observablehq/framework/downloads-dark.svg"> <img alt="Daily downloads of Observable Framework" src="https://observablehq.observablehq.cloud/oss-analytics/@observablehq/framework/downloads.svg"> </picture> </a><sub>Daily downloads of Observable Framework · oss-analytics</sub>
https://observablehq.com/framework/
https://github.com/observablehq/framework/tree/main/examples
https://github.com/observablehq/framework/releases
Please open a discussion if you’d like help. We also recommend searching issues.
See Contributing.